| General Statistics |
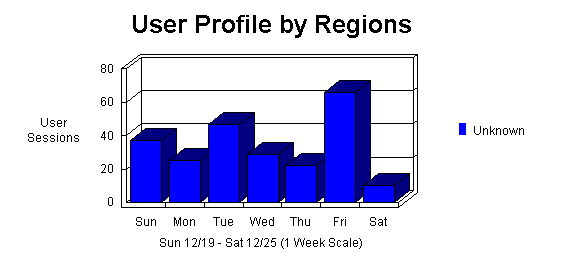
The User Profile by Regions graph identifies the general location of the visitors to your Web site. The General Statistics table includes statistics on the total activity for this web site during the designated time frame.
 |
|
| |
| Date & Time This Report was Generated | Monday December 27, 1999 - 12:03:01 |
| Timeframe | 12/19/99 00:00:00 - 12/25/99 23:59:59 |
| Number of Hits for Home Page | N/A |
| Number of Successful Hits for Entire Site | 3,431 |
| Number of Page Views (Impressions) | 362 |
| Number of User Sessions | 236 |
| User Sessions from United States | 0% |
| International User Sessions | 0% |
| User Sessions of Unknown Origin | 100% |
| Average Number of Hits Per Day | 490 |
| Average Number of Page Views Per Day | 51 |
| Average Number of User Sessions Per Day | 33 |
| Average User Session Length | 00:05:47 |
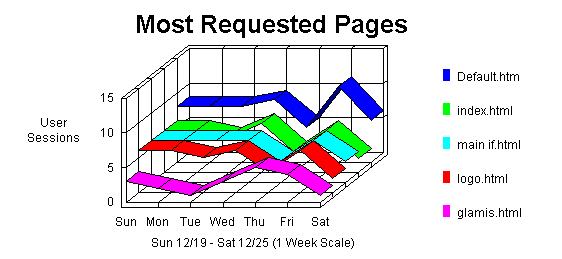
| Most Requested Pages |
This section identifies the most popular web site pages and how often they were accessed. The average time a user spends viewing a page is also indicated in the table.
 |
|
| |||||
| 1 | http://209.237.140.234/Default.htm | 60 | 16.57% | 55 | 00:00:33 |
| 2 | http://209.237.140.234/index.html | 41 | 11.32% | 35 | 00:00:04 |
| 3 | http://209.237.140.234/main_if.html | 41 | 11.32% | 36 | 00:00:46 |
| 4 | http://209.237.140.234/logo.html | 39 | 10.77% | 34 | 00:00:03 |
| 5 | http://209.237.140.234/glamis.html | 20 | 5.52% | 19 | 00:01:30 |
| 6 | http://209.237.140.234/offroad.html | 20 | 5.52% | 17 | 00:02:07 |
| 7 | http://209.237.140.234/links.html | 19 | 5.24% | 16 | 00:04:03 |
| 8 | http://209.237.140.234/pismo.html | 17 | 4.69% | 16 | 00:01:26 |
| 9 | http://209.237.140.234/ddd.html | 15 | 4.14% | 14 | 00:01:02 |
| 10 | http://209.237.140.234/girl2.html | 11 | 3.03% | 11 | 00:05:08 |
| Sub Total For the Page Views Above | 362 | 100% | N/A | N/A | |
| Total For the Log File | 362 | 100% | N/A | N/A | |
| Least Requested Pages |
This section identifies the least popular pages on your Web site, and how often they were accessed.
|
| ||||
| 1 | http://209.237.140.234/girl3.html | 1 | 0.27% | 1 |
| 2 | http://209.237.140.234/girl4.html | 2 | 0.55% | 2 |
| 3 | http://209.237.140.234/rings.html | 3 | 0.82% | 3 |
| 4 | http://209.237.140.234/contacts.html | 3 | 0.82% | 3 |
| 5 | http://209.237.140.234/weekly_b.htm | 4 | 1.1% | 4 |
| 6 | http://209.237.140.234/ddd3.html | 4 | 1.1% | 4 |
| 7 | http://209.237.140.234/ff.html | 5 | 1.38% | 5 |
| 8 | http://209.237.140.234/phbk.html | 5 | 1.38% | 5 |
| 9 | http://209.237.140.234/ddd2.html | 7 | 1.93% | 7 |
| 10 | http://209.237.140.234/glamis1.html | 8 | 2.2% | 8 |
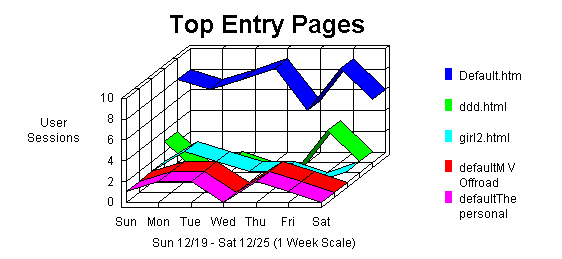
| Top Entry Pages |
This section identifies the first hit from a user visiting this site. This is most likely the home page but, in some cases, it may also be specific URLs that users enter to access a particular page directly. The percentages refer to the total number of user sessions.
 |
|
| |||
| 1 | http://209.237.140.234/Default.htm | 22.03% | 52 |
| 2 | http://209.237.140.234/ddd.html | 3.81% | 9 |
| 3 | http://209.237.140.234/girl2.html | 3.81% | 9 |
| 4 | http://209.237.140.234/images/defaultM_V_Offroad.jpg | 3.38% | 8 |
| 5 | http://209.237.140.234/images/defaultThe_personal_pages_o.jpg | 3.38% | 8 |
| 6 | http://209.237.140.234/images/is_single_pixel_gif.gif | 3.38% | 8 |
| 7 | http://209.237.140.234/glamis.html | 2.96% | 7 |
| 8 | http://209.237.140.234/images/defaultDixon_Design__.jpg | 2.54% | 6 |
| 9 | http://209.237.140.234/logo.html | 2.54% | 6 |
| 10 | http://209.237.140.234/images/defaultYour_connection_for_.jpg | 2.54% | 6 |
| Total For the Pages Above | 50.42% | 119 | |
| Top Exit Pages |
This section identifies the pages users were on when they left the site. The percentages refer to the total number of user sessions that started with a valid Document Type. If the session started on a document with a different type (such as a graphic or sound file), the file is not counted as an Entry Page, and the session is not counted in the total.
|
| |||
| 1 | http://209.237.140.234/Default.htm | 24.19% | 30 |
| 2 | http://209.237.140.234/links.html | 8.87% | 11 |
| 3 | http://209.237.140.234/girl2.html | 6.45% | 8 |
| 4 | http://209.237.140.234/glamis.html | 5.64% | 7 |
| 5 | http://209.237.140.234/main_if.html | 5.64% | 7 |
| 6 | http://209.237.140.234/offroad.html | 5.64% | 7 |
| 7 | http://209.237.140.234/index.html | 5.64% | 7 |
| 8 | http://209.237.140.234/ddd.html | 4.83% | 6 |
| 9 | http://209.237.140.234/pismo.html | 4.83% | 6 |
| 10 | http://209.237.140.234/logo.html | 4.03% | 5 |
| Total For the Pages Above (only sessions starting on a valid document type are included) | 75.8% | 94 | |
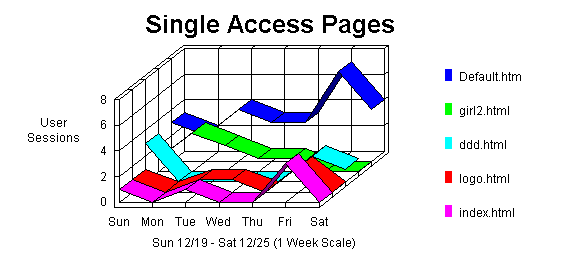
| Single Access Pages |
This section identifies the pages on the site that visitors access and exit without viewing any other page. The percentages refer to the total number of user sessions that started with a valid Document Type. If the session started on a document with a different type (such as a graphic or sound file), the file is not counted as an Entry Page, and the session is not counted in the total
 |
|
| |||
| 1 | http://209.237.140.234/Default.htm | 30.95% | 26 |
| 2 | http://209.237.140.234/girl2.html | 9.52% | 8 |
| 3 | http://209.237.140.234/ddd.html | 7.14% | 6 |
| 4 | http://209.237.140.234/logo.html | 5.95% | 5 |
| 5 | http://209.237.140.234/index.html | 5.95% | 5 |
| 6 | http://209.237.140.234/main_if.html | 5.95% | 5 |
| 7 | http://209.237.140.234/glamis.html | 5.95% | 5 |
| 8 | http://209.237.140.234/pismo.html | 5.95% | 5 |
| 9 | http://209.237.140.234/offroad.html | 4.76% | 4 |
| 10 | http://209.237.140.234/phbk.html | 2.38% | 2 |
| Total For the Pages Above | 84.52% | 71 | |
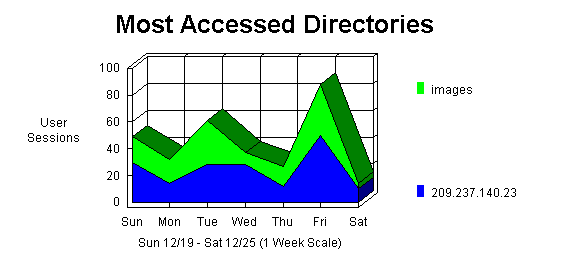
| Most Accessed Directories |
This section analyzes accesses to the directories of the site. This information can be useful in determining the types of data most often requested.
 |
|
| |||||
| http://209.237.140.234/ | 1,885 | 54.94% | 90.29% | 20,943K | 172 |
| http://209.237.140.234/images | 1,546 | 45.05% | 78.65% | 3,093K | 136 |
| Top Paths Through Site |
This section identifies the paths people most often follow when visiting the site. The path begins at the page of entry and shows the next six consecutive pages viewed.
|
| |||
| 1 | 1. http://209.237.140.234/Default.htm | 20.96% | 26 |
| 2 | 1. http://209.237.140.234/girl2.html | 6.45% | 8 |
| 3 | 1. http://209.237.140.234/ddd.html | 4.83% | 6 |
| 4 | 1. http://209.237.140.234/logo.html | 4.03% | 5 |
| 5 | 1. http://209.237.140.234/index.html | 4.03% | 5 |
| 6 | 1. http://209.237.140.234/main_if.html | 4.03% | 5 |
| 7 | 1. http://209.237.140.234/glamis.html | 4.03% | 5 |
| 8 | 1. http://209.237.140.234/pismo.html | 4.03% | 5 |
| 9 | 1. http://209.237.140.234/offroad.html | 3.22% | 4 |
| 10 | 1. http://209.237.140.234/Default.htm 2. http://209.237.140.234/index.html 3. http://209.237.140.234/logo.html 4. http://209.237.140.234/main_if.html 5. http://209.237.140.234/offroad.html 6. http://209.237.140.234/glamis.html | 2.41% | 3 |
| Total For the Paths Above | 58.06% | 72 | |
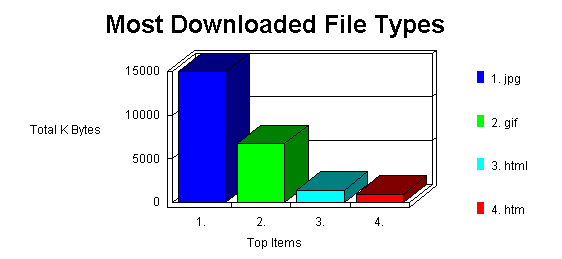
| Most Downloaded File Types and Sizes |
This section identifies the accessed file types and the total kilobytes downloaded for each file type. Cached requests and erred hits are excluded from the totals.
 |
|
| |||
| 1 | jpg | 2,118 | 14,960K |
| 2 | gif | 479 | 6,731K |
| 3 | html | 264 | 1,398K |
| 4 | htm | 57 | 948K |
| Total Files & K Bytes Transferred | 2,918 | 24,036K | |
| Top Users |
This section identifies the IP address and/or domain name and their relative activity level on the site. WebTrends cannot differentiate between different users using the same IP address.
|
| ||||
| 1 | 24.7.90.120 | 552 | 16.08% | 9 |
| 2 | 204.60.201.45 | 317 | 9.23% | 1 |
| 3 | 207.207.207.125 | 204 | 5.94% | 2 |
| 4 | 4.54.90.226 | 139 | 4.05% | 1 |
| 5 | 158.252.212.12 | 135 | 3.93% | 1 |
| 6 | 198.107.240.10 | 134 | 3.9% | 1 |
| 7 | 207.251.149.117 | 97 | 2.82% | 1 |
| 8 | 38.27.95.163 | 96 | 2.79% | 1 |
| 9 | 12.73.235.196 | 95 | 2.76% | 1 |
| 10 | 192.11.226.102 | 89 | 2.59% | 1 |
| Subtotal for Users Above | 1,858 | 54.15% | 19 | |
| Total | 3,431 | 100% | 236 | |
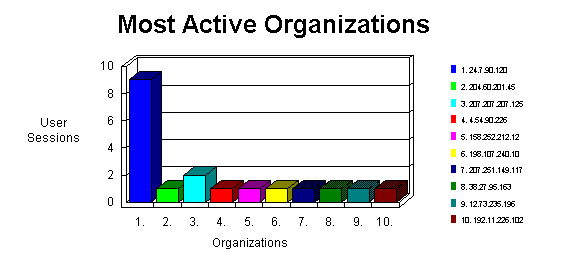
| Most Active Organizations |
This section identifies the companies or organizations that accessed the site the most often.
 |
|
| ||||
| 1 | 24.7.90.120 | 552 | 16.08% | 9 |
| 2 | 204.60.201.45 | 317 | 9.23% | 1 |
| 3 | 207.207.207.125 | 204 | 5.94% | 2 |
| 4 | 4.54.90.226 | 139 | 4.05% | 1 |
| 5 | 158.252.212.12 | 135 | 3.93% | 1 |
| 6 | 198.107.240.10 | 134 | 3.9% | 1 |
| 7 | 207.251.149.117 | 97 | 2.82% | 1 |
| 8 | 38.27.95.163 | 96 | 2.79% | 1 |
| 9 | 12.73.235.196 | 95 | 2.76% | 1 |
| 10 | 192.11.226.102 | 89 | 2.59% | 1 |
| Subtotal For Companies Above | 1,858 | 54.15% | 19 | |
| Total For the Log File | 3,431 | 100% | 236 | |
| Summary of Activity for Report Period |
This section outlines general server activity, comparing the level of activity on weekdays and weekends. The Average Number of Users and Hits on Weekdays are the averages for each individual week day. The Average Number of Users and Hits for Weekends groups Saturday and Sunday together. Values in the table do not include erred hits.
|
| |
| Average Number of Users per day on Weekdays | 37 |
| Average Number of Hits per day on Weekdays | 576 |
| Average Number of Users for the entire Weekend | 47 |
| Average Number of Hits for the entire Weekend | 551 |
| Most Active Day of the Week | Mon |
| Least Active Day of the Week | Sat |
| Most Active Day Ever | December 20, 1999 |
| Number of Hits on Most Active Day | 673 |
| Least Active Day Ever | December 25, 1999 |
| Number of Hits on Least Active Day | 164 |
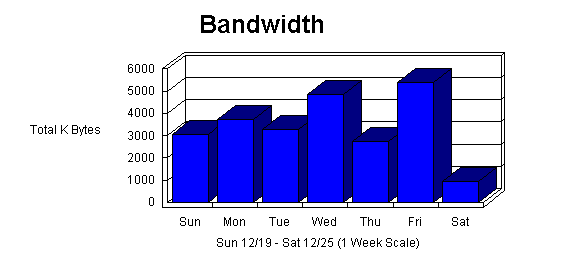
| Summary of Activity by Time Increment |
This section helps you understand the bandwidth requirements of the site by indicating the volume of activity in kilobytes transferred. The table provides various measures of activity by unit of time for the report period (the unit of time depends on the amount of time covered by the report, and will be the day in most cases).
 |
|
| ||||
| 12/19 | 387 | 46 | 3,063 | 37 |
| 12/20 | 673 | 59 | 3,738 | 25 |
| 12/21 | 533 | 45 | 3,285 | 47 |
| 12/22 | 622 | 61 | 4,858 | 29 |
| 12/23 | 394 | 37 | 2,755 | 22 |
| 12/24 | 658 | 91 | 5,396 | 66 |
| 12/25 | 164 | 23 | 944 | 10 |
| Total | 3,431 | 362 | 24,036 | 236 |
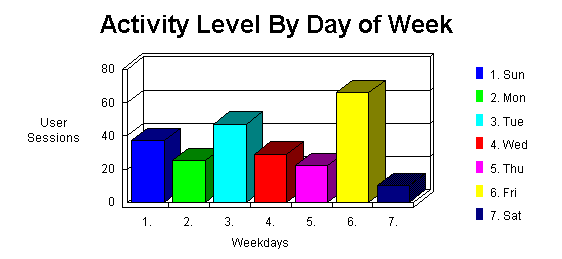
| Activity Level by Day of Week |
This section shows the activity for each day of the week for the report period (i.e. if there are two Mondays in the report period, the value presented is the sum of all hits for both Mondays.) Values in the table do not include erred hits.
 |
|
| ||||
| 1 | Sun | 387 | 11.27% | 37 |
| 2 | Mon | 673 | 19.61% | 25 |
| 3 | Tue | 533 | 15.53% | 47 |
| 4 | Wed | 622 | 18.12% | 29 |
| 5 | Thu | 394 | 11.48% | 22 |
| 6 | Fri | 658 | 19.17% | 66 |
| 7 | Sat | 164 | 4.77% | 10 |
| Total Weekdays | 2,880 | 83.94% | 189 | |
| Total Weekend | 551 | 16.05% | 47 | |
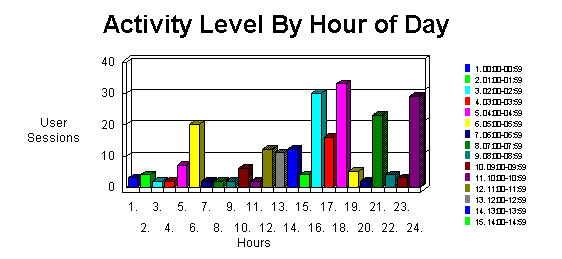
| Activity Level by Hour of the Day |
This section shows the most and the least active hour of the day for the report period. The second table breaks down activity for the given report period to show the average activity for each individual hour of the day (if there are several days in the report period, the value presented is the sum of all hits during that period of time for all days). All times are referenced to the location of the system running the analysis.
 |
|
| |
| Most Active Hour of the Day | 23:00-23:59 |
| Least Active Hour of the Day | 08:00-08:59 |
|
| |||
| 00:00-00:59 | 169 | 4.92% | 3 |
| 01:00-01:59 | 300 | 8.74% | 4 |
| 02:00-02:59 | 69 | 2.01% | 2 |
| 03:00-03:59 | 11 | 0.32% | 2 |
| 04:00-04:59 | 20 | 0.58% | 7 |
| 05:00-05:59 | 57 | 1.66% | 20 |
| 06:00-06:59 | 25 | 0.72% | 2 |
| 07:00-07:59 | 7 | 0.2% | 2 |
| 08:00-08:59 | 3 | 0.08% | 2 |
| 09:00-09:59 | 36 | 1.04% | 6 |
| 10:00-10:59 | 94 | 2.73% | 2 |
| 11:00-11:59 | 67 | 1.95% | 12 |
| 12:00-12:59 | 244 | 7.11% | 11 |
| 13:00-13:59 | 106 | 3.08% | 12 |
| 14:00-14:59 | 41 | 1.19% | 4 |
| 15:00-15:59 | 402 | 11.71% | 30 |
| 16:00-16:59 | 266 | 7.75% | 16 |
| 17:00-17:59 | 118 | 3.43% | 33 |
| 18:00-18:59 | 104 | 3.03% | 5 |
| 19:00-19:59 | 120 | 3.49% | 2 |
| 20:00-20:59 | 232 | 6.76% | 23 |
| 21:00-21:59 | 416 | 12.12% | 4 |
| 22:00-22:59 | 107 | 3.11% | 3 |
| 23:00-23:59 | 417 | 12.15% | 29 |
| Total Users during Work Hours (8:00am-5:00pm) | 1,259 | 36.69% | 95 |
| Total Users during After Hours (5:01pm-7:59am) | 2,172 | 63.3% | 141 |
| Technical Statistics and Analysis |
This table shows the total number of hits for the site, how many were successful, how many failed, and calculates the percentage of hits that failed. It may help you in determining the reliability of the site.
|
| |
| Total Hits | 3,450 |
| Successful Hits | 3,431 |
| Failed Hits | 19 |
| Failed Hits as Percent | 0.55% |
| Cached Hits | 513 |
| Cached Hits as Percent | 14.86% |
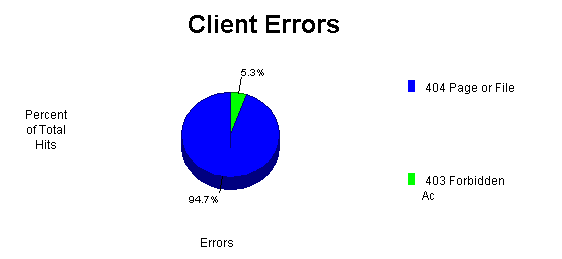
| Client Errors |
This section identifies the type of errors which were returned by the Client accessing your server.
 |
|
| ||
| 404 Page or File Not Found | 18 | 94.73% |
| 403 Forbidden Access | 1 | 5.26% |
| Total | 19 | 100% |
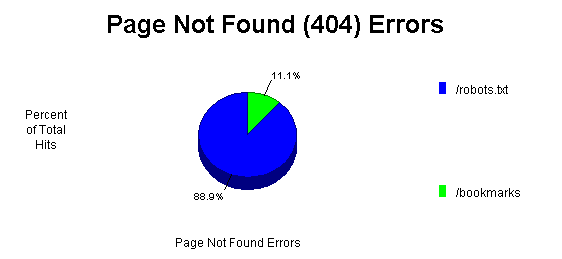
| Page Not Found (404) Errors |
This section identifies "Page Not Found" (404) errors which occurred on the server.
 |
|
| ||
| /robots.txt (no referrer) | 16 | 88.88% |
| /bookmarks (no referrer) | 2 | 11.11% |
| Total | 18 | 100% |
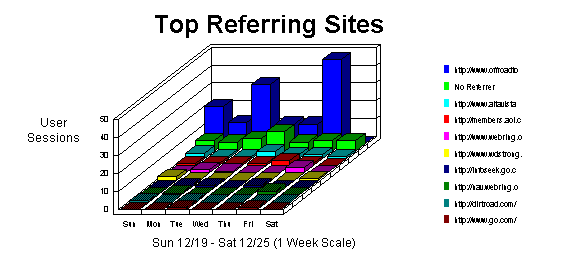
| Top Referring Sites |
This section identifies the domain names or numeric IP addresses with links to the site. This information will only be displayed if your server is logging this information.
 |
|
| ||
| 1 | http://www.offroadtoys.com/ | 135 |
| 2 | No Referrer | 46 |
| 3 | http://www.altavista.com/ | 14 |
| 4 | http://members.aol.com/ | 8 |
| 5 | http://www.webring.org/ | 6 |
| 6 | http://www.wdstrong.com/ | 3 |
| 7 | http://infoseek.go.com/ | 3 |
| 8 | http://nav.webring.org/ | 3 |
| 9 | http://dirtroad.com/ | 2 |
| 10 | http://www.go.com/ | 2 |
| 11 | http://www.dogpile.com/ | 1 |
| 12 | http://www.infoseek.de/ | 1 |
| 13 | http://ink.yahoo.com/ | 1 |
| 14 | http://www.aj.com/ | 1 |
| 15 | http://search.metacrawler.com/ | 1 |
| 16 | http://www.geocities.com/ | 1 |
| 17 | http://hotbot.lycos.com/ | 1 |
| 18 | http://www.profusion.com/ | 1 |
| 19 | http://search.msn.com/ | 1 |
| 20 | http://clubs.yahoo.com/ | 1 |
| Sub Total for the Referring Sites Above | 232 | |
| Total for the Log File | 236 | |
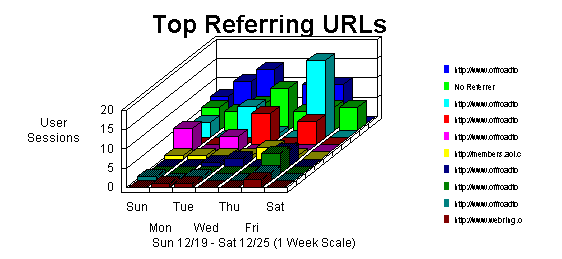
| Top Referring URLs |
This section provides the full URLs of the sites with links to the site. This information will only be displayed if your server is logging the referrer information.
 |
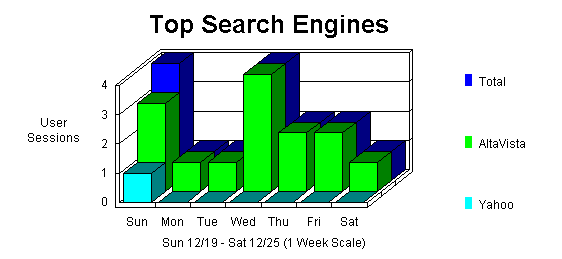
| Top Search Engines |
The graphic illustrates the new user sessions initiated by searches from each search engine. The first table identifies which search engines referred visitors to the site the most often. Note that each search may contain several keywords. The second table identifies the main keywords for each search engine.
 |
|
| |||
| 1 | AltaVista | 15 | 93.75% |
| 2 | Yahoo | 1 | 6.25% |
| Total of Searches for the Engines Above | 16 | 100% | |
| Total of Searches for the Log File | 16 | 100% | |
|
| |||
| Yahoo | jeep wrangler pictures | 1 | 6.25% |
| AltaVista | glamis | 4 | 25% |
| sequoia national forest | 2 | 12.5% | |
| jeep wranglers for sale | 1 | 6.25% | |
| glamis, ca. | 1 | 6.25% | |
| pismo beach ca | 1 | 6.25% | |
| 35x12.50x16 | 1 | 6.25% | |
| pismo beach lodging | 1 | 6.25% | |
| pismo, dunes | 1 | 6.25% | |
| quad racer | 1 | 6.25% | |
| pismo beach ca rentals | 1 | 6.25% | |
|
| |||
| AltaVista | glamis | 4 | 25% |
| beach | 3 | 18.75% | |
| pismo | 3 | 18.75% | |
| ca | 2 | 12.5% | |
| forest | 2 | 12.5% | |
| sequoia | 2 | 12.5% | |
| national | 2 | 12.5% | |
| glamis, | 1 | 6.25% | |
| ca. | 1 | 6.25% | |
| 35x12.50x16 | 1 | 6.25% | |
| Yahoo | pictures | 1 | 6.25% |
| wrangler | 1 | 6.25% | |
| jeep | 1 | 6.25% | |
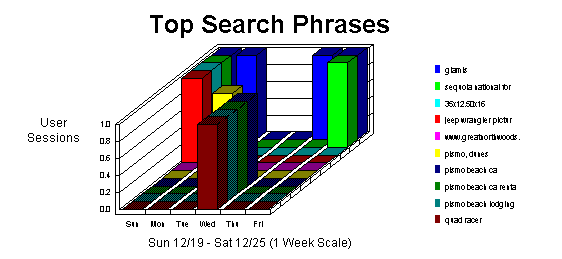
| Top Search Phrases |
The first table identifies Phrases which led the most visitors to the site (regardless of the search engine). The second table identifies, for each phrase, which search engines led visitors to the site.
 |
|
| |||
| 1 | glamis | 4 | 25% |
| 2 | sequoia national forest | 2 | 12.5% |
| 3 | 35x12.50x16 | 1 | 6.25% |
| 4 | jeep wrangler pictures | 1 | 6.25% |
| 5 | www.greatnorthwoods.org | 1 | 6.25% |
| 6 | pismo, dunes | 1 | 6.25% |
| 7 | pismo beach ca | 1 | 6.25% |
| 8 | pismo beach ca rentals | 1 | 6.25% |
| 9 | pismo beach lodging | 1 | 6.25% |
| 10 | quad racer | 1 | 6.25% |
| Total Found for the Phrases Above | 14 | 87.5% | |
| Total of Phrases Found in the Log File | 16 | 100% | |
|
| |||
| glamis | AltaVista | 4 | 25% |
| sequoia national forest | AltaVista | 2 | 12.5% |
| 35x12.50x16 | AltaVista | 1 | 6.25% |
| jeep wrangler pictures | Yahoo | 1 | 6.25% |
| www.greatnorthwoods.org | AltaVista | 1 | 6.25% |
| pismo, dunes | AltaVista | 1 | 6.25% |
| pismo beach ca | AltaVista | 1 | 6.25% |
| pismo beach ca rentals | AltaVista | 1 | 6.25% |
| pismo beach lodging | AltaVista | 1 | 6.25% |
| quad racer | AltaVista | 1 | 6.25% |
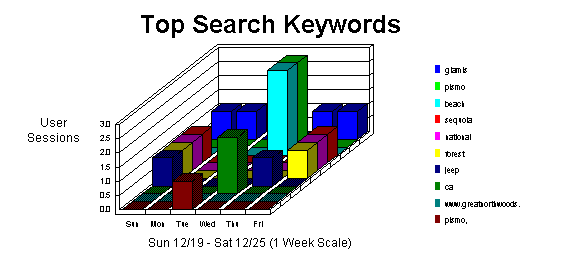
| Top Search Keywords |
The first table identifies keywords which led the most visitors to the site (regardless of the search engine). The second table identifies, for each keyword, which search engines led visitors to the site.
 |
|
| |||
| 1 | glamis | 4 | 11.42% |
| 2 | pismo | 3 | 8.57% |
| 3 | beach | 3 | 8.57% |
| 4 | sequoia | 2 | 5.71% |
| 5 | national | 2 | 5.71% |
| 6 | forest | 2 | 5.71% |
| 7 | jeep | 2 | 5.71% |
| 8 | ca | 2 | 5.71% |
| 9 | www.greatnorthwoods.org | 1 | 2.85% |
| 10 | pismo, | 1 | 2.85% |
| Total Found for the Keywords Above | 22 | 62.85% | |
| Total of Keywords Found in the Log File | 35 | 100% | |
|
| |||
| glamis | AltaVista | 4 | 11.42% |
| pismo | AltaVista | 3 | 8.57% |
| beach | AltaVista | 3 | 8.57% |
| sequoia | AltaVista | 2 | 5.71% |
| national | AltaVista | 2 | 5.71% |
| forest | AltaVista | 2 | 5.71% |
| jeep | Yahoo | 1 | 2.85% |
| AltaVista | 1 | 2.85% | |
| ca | AltaVista | 2 | 5.71% |
| www.greatnorthwoods.org | AltaVista | 1 | 2.85% |
| pismo, | AltaVista | 1 | 2.85% |
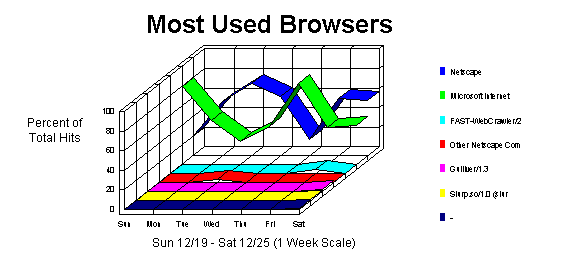
| Most Used Browsers |
This section identifies the most popular WWW Browsers used by visitors to the site. This information will only be displayed if your server is logging the browser/platform information.
 |
|
| ||||
| 1 | Netscape | 1,761 | 51.32% | 32 |
| 2 | Microsoft Internet Explorer | 1,613 | 47.01% | 189 |
| 3 | FAST-WebCrawler/2.0.9 (crawler@fast.no; http://www.fast.no/faq/faqfastwebsearch/faqfastwebcrawler.h | 27 | 0.78% | 4 |
| 4 | Other Netscape Compatible | 17 | 0.49% | 0 |
| 5 | Gulliver/1.3 | 7 | 0.2% | 5 |
| 6 | Slurp.so/1.0 (slurp@inktomi.com; http://www.inktomi.com/slurp.html) | 5 | 0.14% | 5 |
| 7 | - | 1 | 0.02% | 1 |
| Total For Browsers Above | 3,431 | 100% | 236 | |
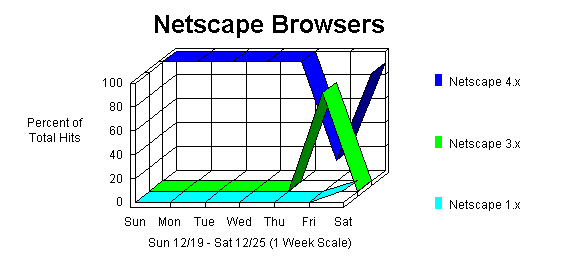
| Netscape Browsers |
This section gives you a breakdown of the various versions of Netscape browsers that visitors to the site are using.
 |
|
| ||||
| 1 | Netscape 4.x | 1,435 | 81.48% | 30 |
| 2 | Netscape 3.x | 317 | 18% | 1 |
| 3 | Netscape 1.x | 9 | 0.51% | 1 |
| Total For Browsers Above | 1,761 | 100% | 32 | |
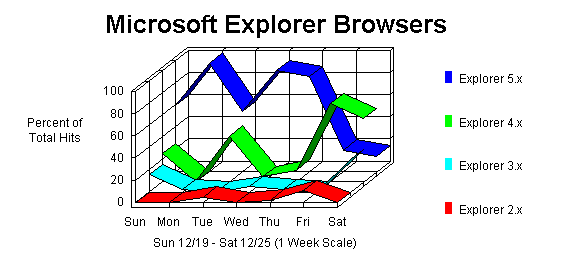
| Microsoft Explorer Browsers |
This section gives you a breakdown of the various versions of Microsoft Explorer browsers that visitors to the site are using.
 |
|
| ||||
| 1 | Explorer 5.x | 1,098 | 68.07% | 84 |
| 2 | Explorer 4.x | 384 | 23.8% | 36 |
| 3 | Explorer 3.x | 92 | 5.7% | 44 |
| 4 | Explorer 2.x | 39 | 2.41% | 25 |
| Total For Browsers Above | 1,613 | 100% | 189 | |
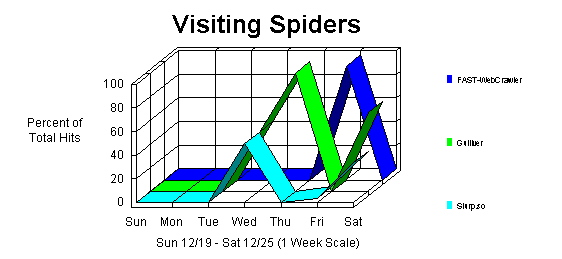
| Visiting Spiders |
This section identifies all robots, spiders, crawlers and search services (i.e. Alta Vista, Lycos, and Excite) visiting the site.
 |
|
| ||||
| 1 | FAST-WebCrawler | 27 | 69.23% | 4 |
| 2 | Gulliver | 7 | 17.94% | 5 |
| 3 | Slurp.so | 5 | 12.82% | 5 |
| Total For Spiders Above | 39 | 100% | 14 | |
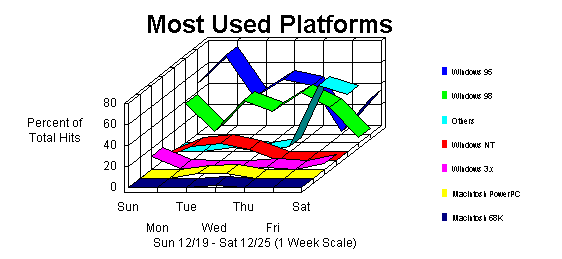
| Most Used Platforms |
This section identifies the operating systems most used by the visitors to the site.
 |
|
| ||||
| 1 | Windows 95 | 1,450 | 42.26% | 56 |
| 2 | Windows 98 | 1,038 | 30.25% | 82 |
| 3 | Others | 553 | 16.11% | 45 |
| 4 | Windows NT | 255 | 7.43% | 6 |
| 5 | Windows 3.x | 71 | 2.06% | 35 |
| 6 | Macintosh PowerPC | 53 | 1.54% | 11 |
| 7 | Macintosh 68K | 11 | 0.32% | 1 |
| Total For Platforms Above | 3,431 | 100% | 236 | |
This report was generated by WebTrends.